Bizz View
Catering and Ballroom Rental Financial Model - Excel File
Catering and Ballroom Rental Financial Model - Excel File
Couldn't load pickup availability
PURPOSE OF MODEL
This Excel model is a highly adaptable and user-friendly tool for creating a 10-year rolling 3-statement financial projection (Income Statement, Balance Sheet, and Cash Flow Statement) with a monthly timeline. It is designed for a startup or existing Catering and ballroom Rental business, generating revenue through event hosting and catering services.
The model allows users to input up to 10 revenue streams of their associate variable cost and other staff costs, operating costs, fixed assets, and borrowings.
Following best practices in financial modeling, the model includes instructions, line item explanations, checks, and input validations. It features a discounted cash flow valuation calculation based on the projected cash flows.
The model features a dedicated sheet for inputting historical data, allowing users to monitor and directly compare actual performance against forecasted figures. Additionally, the model includes an extensive array of charts designed to provide users with a clear visual representation of the business's key metrics and indicators.
KEY OUTPUTS
The key outputs include:
- Detailed financial statements are presented monthly over ten years and summarized annually.
- Valuation sheet
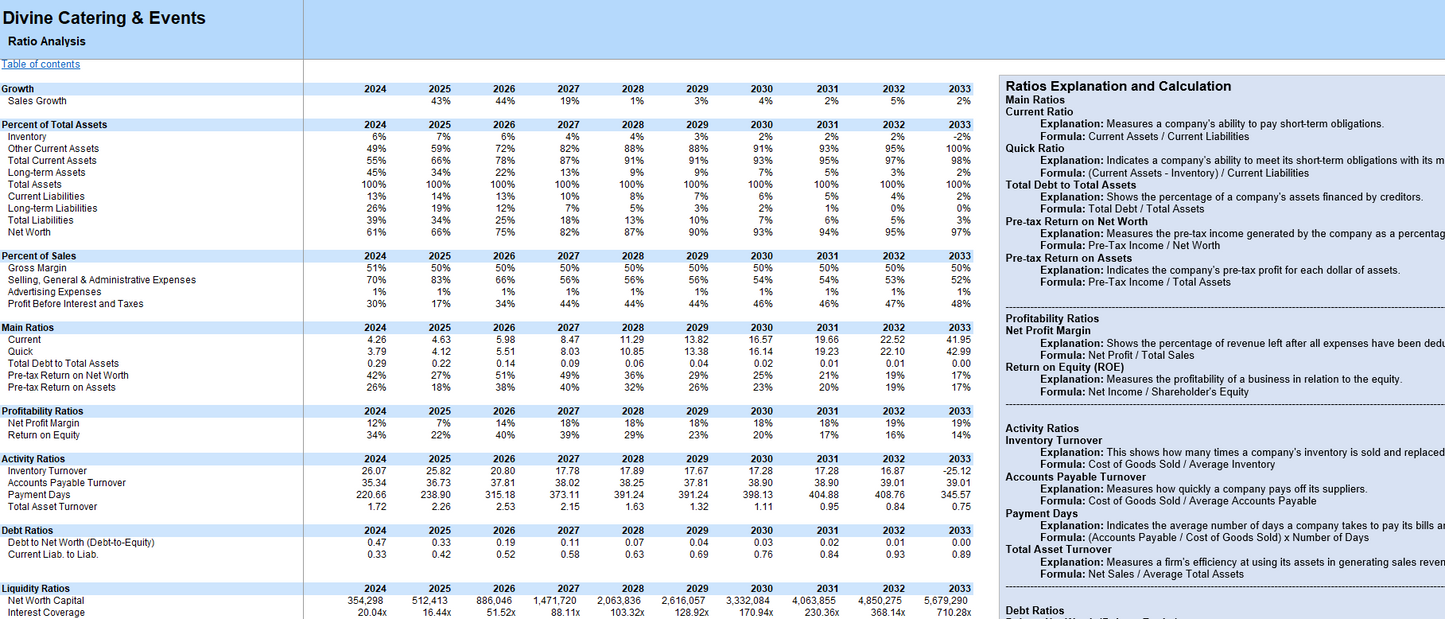
- Over 30 financial and business ratios offering an in-depth company performance analysis.
- A sheet featuring over ten informative charts to comprehend the business dynamics and key drivers visually.
- Breakeven analysis
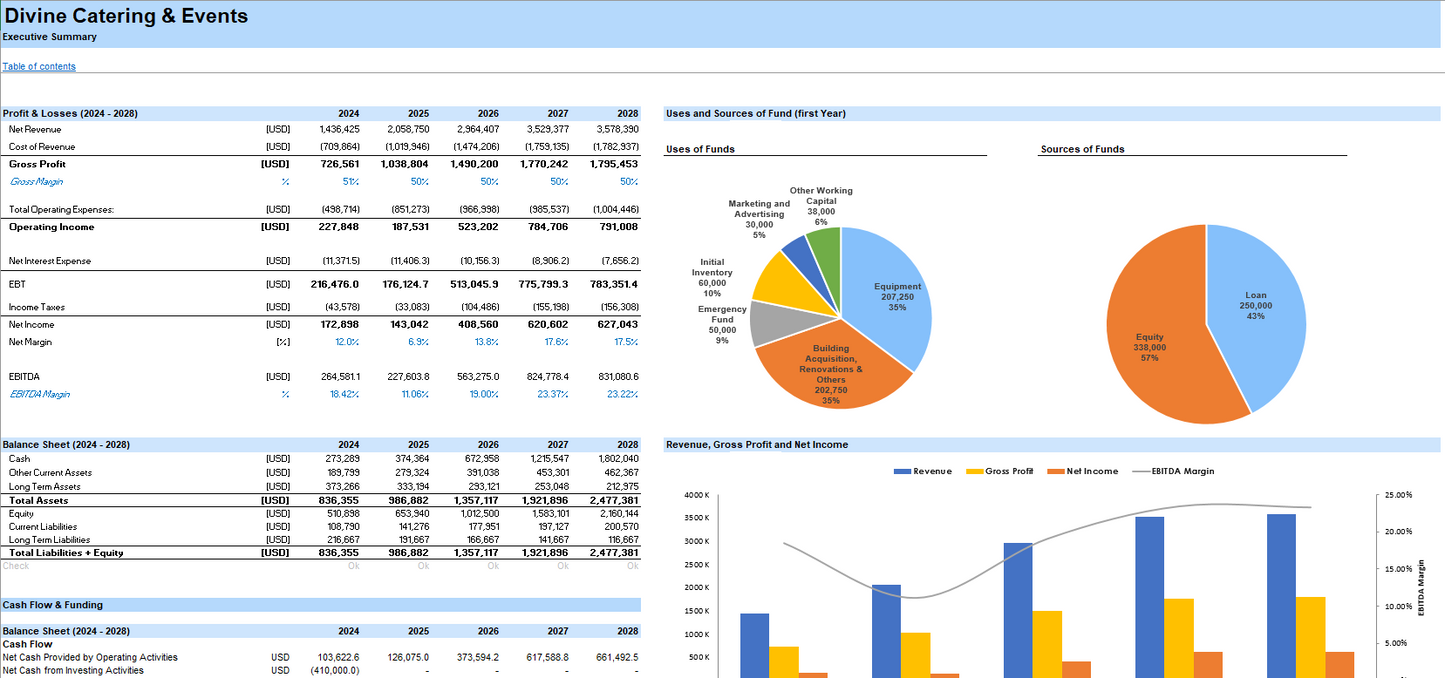
- A dashboard featuring:
- Summaries of projected financial statements;
- Key financial ratios;
- Bar charts visualizing financial projections;
- Revenue and gross profit
- Uses and Sources of Funds
- Cash balance evolution
The model is structured as follows:
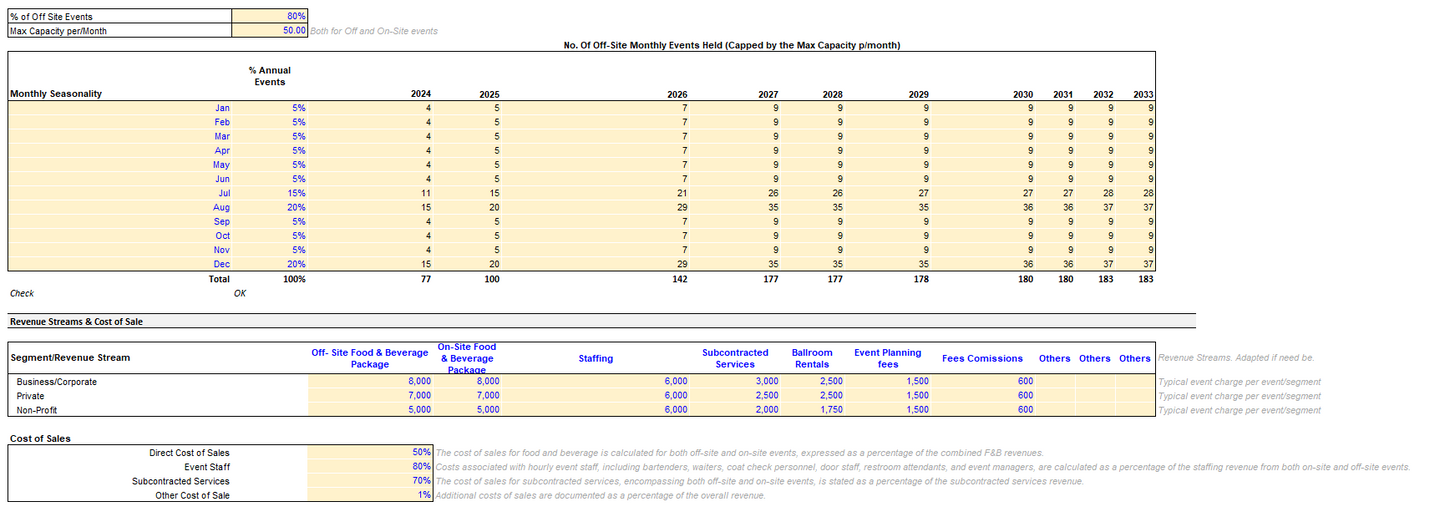
- Assumptions: This sheet serves as the foundation of the financial model, encompassing critical assumptions about revenue, capital expenditures (CapEx), operational expenditures (OpEx), and startup costs tailored to a catering enterprise, which also offers the flexibility to include ballroom rental services.
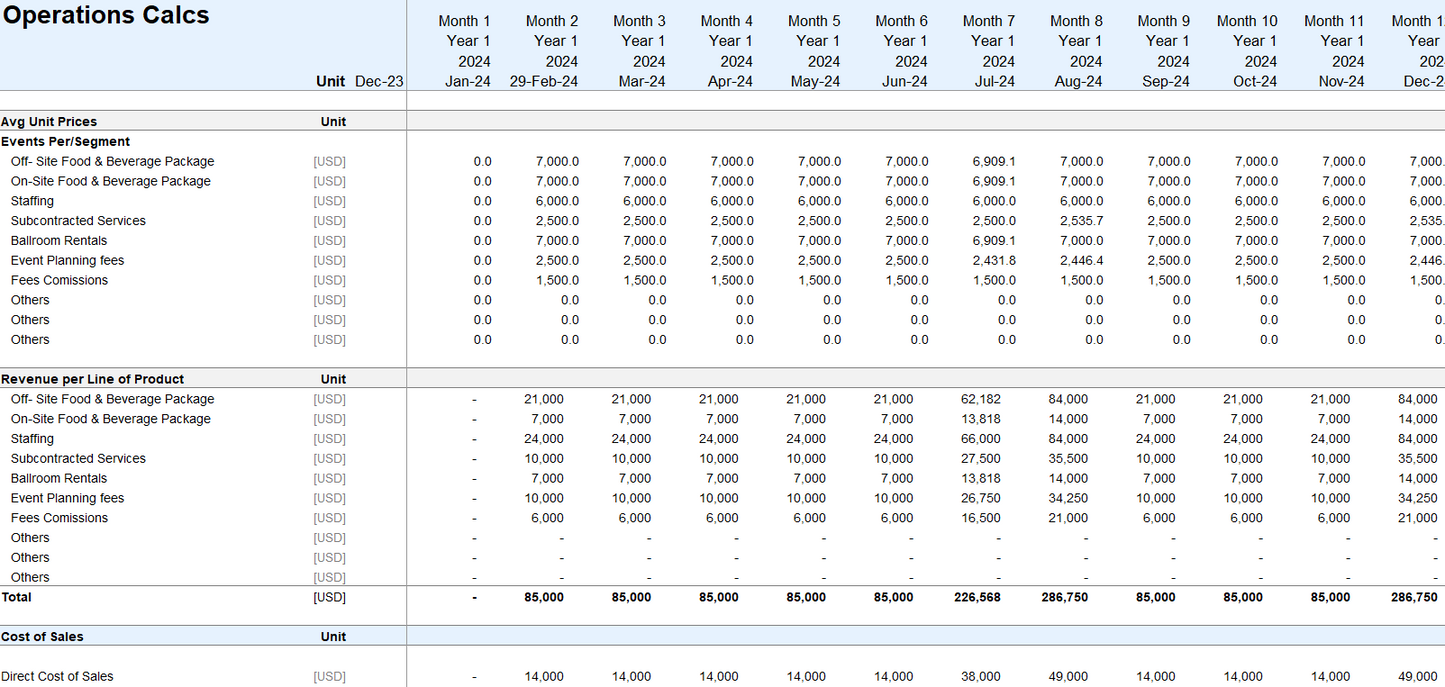
- Operations: This sheet details the calculations for revenue, cost of goods sold (COGS), and OpEx, all derived from the data in the Assumptions sheet.
- Working Capital: Essential for short-term financial health, this sheet calculates the necessary working capital for day-to-day operations.
- Debt Model: Funding methods are crucial for startup manufacturing; this sheet allows for debt structuring aligned with the business's financing assumptions.
- Capital Expenditures (Capex): This sheet is dedicated to the expenses required to acquire and maintain manufacturing equipment and facilities.
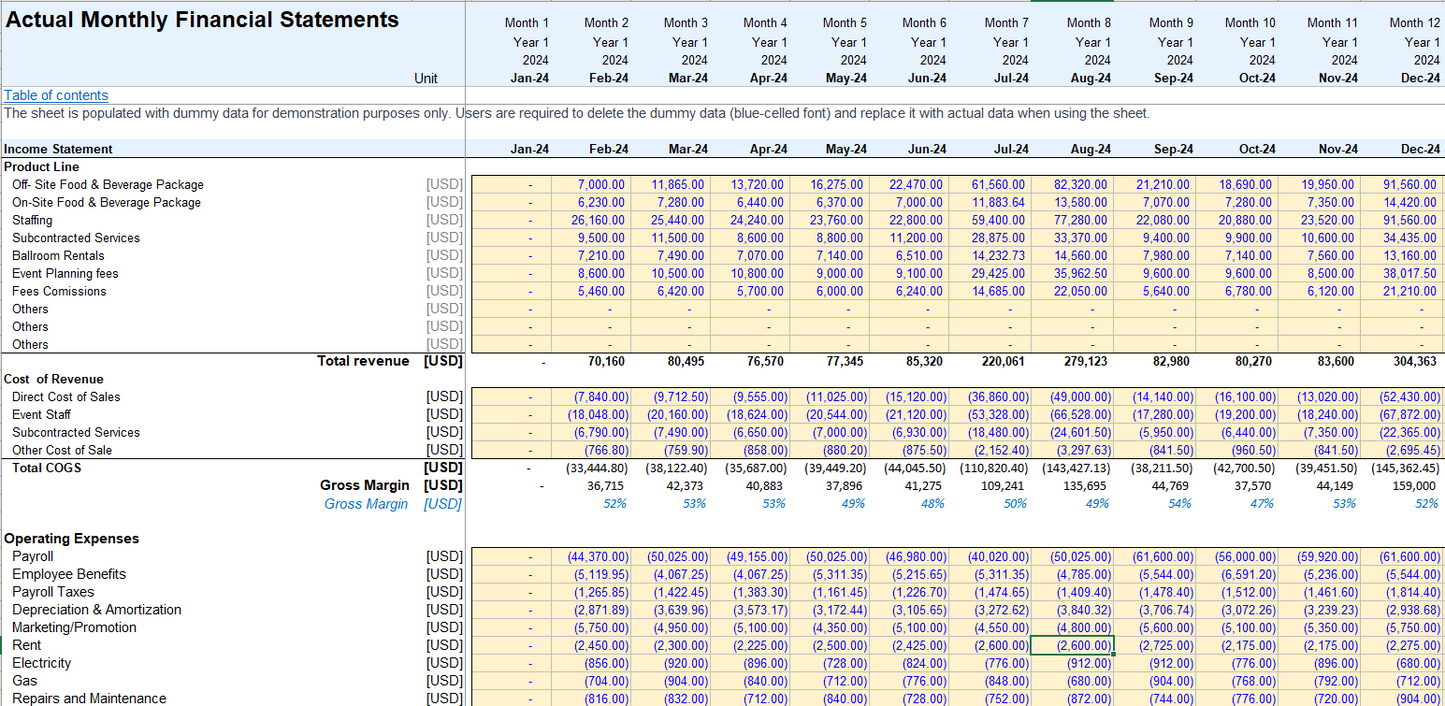
- Monthly Financial Statements (Mo-FS): This sheet includes the income statement, balance sheet, and cash flow statement, reflecting the operations and Capex details. It also has a section for dividend distribution setup if required.
- Actual Performance: As real data comes in, this sheet becomes a record of actual performance to be compared with the forecasted metrics.
- Actual + Budget: This sheet consolidates budget data with existing actual figures, and the data from this sheet is then utilized in the valuation analysis.
- Annual Financial Statements: This sheet consolidates the monthly financial statements and provides a yearly financial overview.
- Summary: An executive summary sheet provides a snapshot of main business metrics for quick assessment.
-
Breakeven Analysis: This sheet helps determine the sales volume needed to cover the costs, a vital metric for new manufacturing businesses.
- Ratios: Over 20 financial ratios are listed here to analyze business performance comprehensively.
- Valuation: Employing the discounted cash flow method in this sheet, one can estimate the business's value.
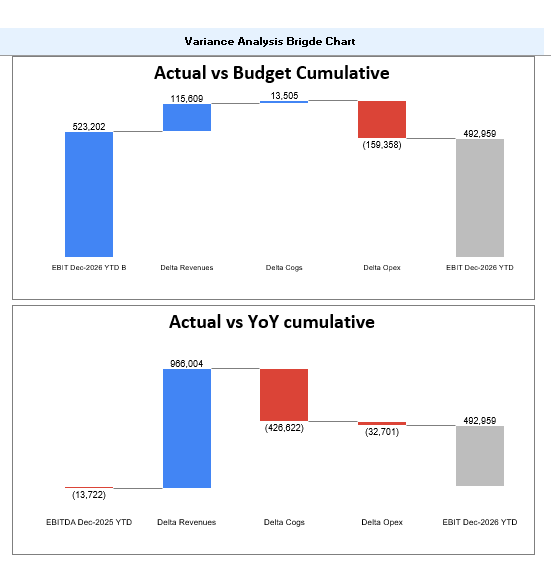
- Budget vs. Actual: By comparing budgeted figures with actual numbers, this sheet helps financial performance evaluation and helps track year-on-year progress.
- Charts: Visual representations of financial data are available to highlight variances and inform decision-making.


