Bizz View
Medical Billing Service Financial Model
Medical Billing Service Financial Model
Couldn't load pickup availability
A complete, investor-ready 10-year financial model for a medical billing service, built in Excel and ready to adapt to your own numbers.
Overview
The Medical Billing Service Financial Model is a fully integrated Excel workbook for planning, funding and running a medical billing service. It turns a short list of operating assumptions (provider-months billed, service line mix, average monthly fee per provider, cost of goods by service line, staff productivity and wages) into a 10-year income statement, balance sheet and cash flow statement, with monthly detail, three scenarios and a discounted cash flow valuation.
Revenue is built the way a medical billing service actually earns it: provider-months billed split between full revenue cycle management, billing & claims submission only, and credentialing, coding audits & consulting, each with its own average monthly fee per provider, less onboarding discounts & fee concessions, plus patient statement & clearinghouse pass-Through fees and setup fees & other income. Direct costs follow the work: billing specialist & coder pay that scales with provider-months billed, clearinghouse & statement cost by service line, payment processing fees, and clearinghouse, statement printing & postage, with the seasonality of the trade built into the monthly statements.
Whether you are launching a billing service, adding client practices and billers, applying for an SBA or bank loan, negotiating a lease or preparing next year's budget, the model gives you professional statements, KPIs and charts in minutes instead of weeks.
Who this model is for
- Owners and founders planning to open or expand a medical billing service.
- Medical billing company owners preparing an annual budget, lease negotiation or loan application.
- Buyers, investors and lenders assessing an acquisition or a funding request.
- Consultants, accountants and fractional CFOs building plans for client practices.
What the model does
- 10-year projections with a full income statement, balance sheet and cash flow statement that always balance.
- Revenue build by service line: full revenue cycle management, billing & claims submission only, and credentialing, coding audits & consulting, each by share of provider-months billed and average monthly fee per provider, plus patient statement & clearinghouse pass-Through fees.
- Clearinghouse & Statement cost modelled separately for each service line, so a change in sales mix flows straight into gross margin.
- Billing Specialist staffing driven automatically by provider-months billed and productivity per team member.
- Client KPIs on the Executive Summary: average monthly fee per provider, provider-month margin %, labor %, occupancy cost % and revenue per employee.
- Base, Best and Worst scenarios on every driver, switched from a single drop-down.
- Capex plan for workstations & dual monitors, servers, security & HIPAA compliance tools, and office setup & furniture with automatic depreciation and replacement; two term loans and a revolving credit line.
- Inventory, payables and receivables driven by days; monthly statements with seasonality, actual vs budget tracking and a rolling forecast.
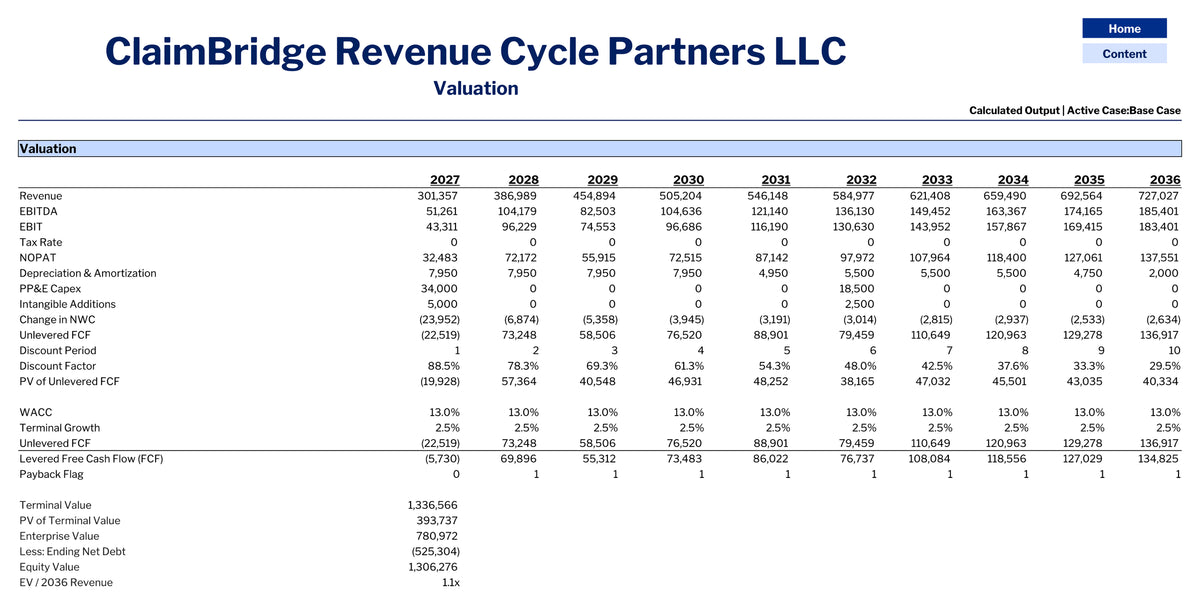
- DCF valuation with enterprise value, equity value, IRR, MOIC, payback and a WACC / growth sensitivity table.
Built for a Medical Billing Service business
The assumptions are not generic: revenue, direct costs and KPIs are modelled with the drivers this type of business actually runs on.
Revenue drivers
- Provider-Months Billed per Year [provider-months billed]
- Full Revenue Cycle Management Mix [% of provider-months billed]
- Average Monthly Fee per Provider - Full Revenue Cycle Management [USD / provider-month]
- Billing & Claims Submission Only Mix [% of provider-months billed]
- Average Monthly Fee per Provider - Billing & Claims Submission Only [USD / provider-month]
- Credentialing, Coding Audits & Consulting Mix [% of provider-months billed]
- Average Monthly Fee per Provider - Credentialing, Coding Audits & Consulting [USD / provider-month]
- Onboarding Discounts & Fee Concessions [% of provider-month sales]
- Patient Statement & Clearinghouse Pass-Through Fees per Provider-Month [USD / provider-month]
- Setup Fees & Other Income [% of provider-month sales]
Cost of revenue drivers
- Full Revenue Cycle Management Cost [% of service line sales]
- Billing & Claims Submission Only Cost [% of service line sales]
- Credentialing, Coding Audits & Consulting Cost [% of service line sales]
- Payment Processing Fees [% of gross sales]
- Shop Supplies [USD / provider-month]
- Clearinghouse, Statement Printing & Postage [USD / provider-month]
- Fee Credits & Uncollected Invoices Rate [% of provider-month sales]
- Provider-Months Billed per Billing Specialist FTE per Year [provider-months billed / FTE]
- Billing Specialist Cost ($/FTE) [USD / FTE]
Operating KPIs on the Executive Summary
Provider-Months Billed, Billing & Claims Submission Only Mix, Average Monthly Fee per Provider, Credentialing, Coding Audits & Consulting Mix, Billing Specialist FTE, Net Revenue per Provider-Month, Direct Cost per Provider-Month, Provider-Month Margin %, Total Labor % of Revenue, Occupancy Cost % of Revenue, Revenue per Employee.
What is inside the workbook
- Cover / Content / Instructions – Title page, clickable table of contents and step-by-step instructions.
- Input – Every assumption in one place: capex, funding, revenue and cost drivers, opex, staffing, working capital, tax, WACC and seasonality.
- Scenarios – Base, Best and Worst versions of every driver with a one-click scenario switch.
- Actuals – Monthly actual results, feeding the forecast and variance reports.
- Rev & COGS – Revenue build and cost of revenue, line by line, for 10 years.
- Personnel – Direct labor driven by volume and productivity, plus the salaried team with hire dates.
- Debt – Two term loans and a revolving credit line with automatic draw and repayment.
- Other Calc – Operating expenses, depreciation and amortization, fixed assets and working capital.
- Annual FS – 10-year income statement, balance sheet and cash flow statement, fully linked and balanced.
- Monthly FS – Monthly statements for any selected year.
- Forecast / Actual vs Budget – Actual-plus-forecast income statement and monthly / year-to-date variance analysis.
- Scenarios Analysis – The three scenarios side by side.
- Executive Summary – 5-year statements, margins, operating KPIs, ratios, trend lines and break-even analysis.
- Charts – Dashboard of eight charts: revenue and margins, cash, cost structure and operating KPIs.
- Valuation – DCF valuation with enterprise and equity value, IRR, MOIC, payback and a WACC / growth sensitivity table.
How to use it
- Open the Input sheet and replace the blue figures in the yellow cells with your own assumptions. Everything else recalculates.
- Use the Scenarios sheet to set how the Best and Worst cases differ from the Base case, and the drop-down to switch between them.
- Review Rev & COGS, Personnel, Debt and Other Calc to check the operating schedules.
- Read the results on Annual FS, Monthly FS, Executive Summary, Charts and Valuation.
- As the business trades, enter monthly results on Actuals to get the rolling forecast and the Actual vs Budget variance report.
The example inside the file
The workbook ships filled in with an illustrative company (ClaimBridge Revenue Cycle Partners LLC) so that every sheet and chart is populated. The figures are sector-typical assumptions, not data from a real company, and are meant to be overwritten.
| 2027 | 2029 | 2031 | |
|---|---|---|---|
| Revenue | $301,357 | $454,894 | $546,148 |
| Gross margin | 56.6% | 56.7% | 56.3% |
| EBITDA | $51,261 | $82,503 | $121,140 |
| Net income | $31,105 | $54,720 | $86,263 |
Technical details
- Microsoft Excel workbook (.xlsx), no macros; works in Excel 2016 or later and Microsoft 365.
- 20 linked sheets, 10-year annual horizon with monthly statements for any selected year.
- Three scenarios (Base, Best, Worst) with a single switch; colour-coded inputs (blue on yellow).
- Currency label and first financial year are inputs, so the model can be re-based in seconds.
- All formulas are open and editable; nothing is locked or hidden behind passwords.